Explanation generated by Owlslide
The Law of Demand and Its Determinants
This page details the behavior of buyers, described by the Law of Demand.
-
The Core Principle: The law states that, ceteris paribus (a Latin phrase meaning "all other things being equal"), there is an inverse relationship between a good's price and the quantity consumers are willing to buy.
- If the price increases (↑), the quantity demanded decreases (↓).
- If the price decreases, the quantity demanded increases.
-
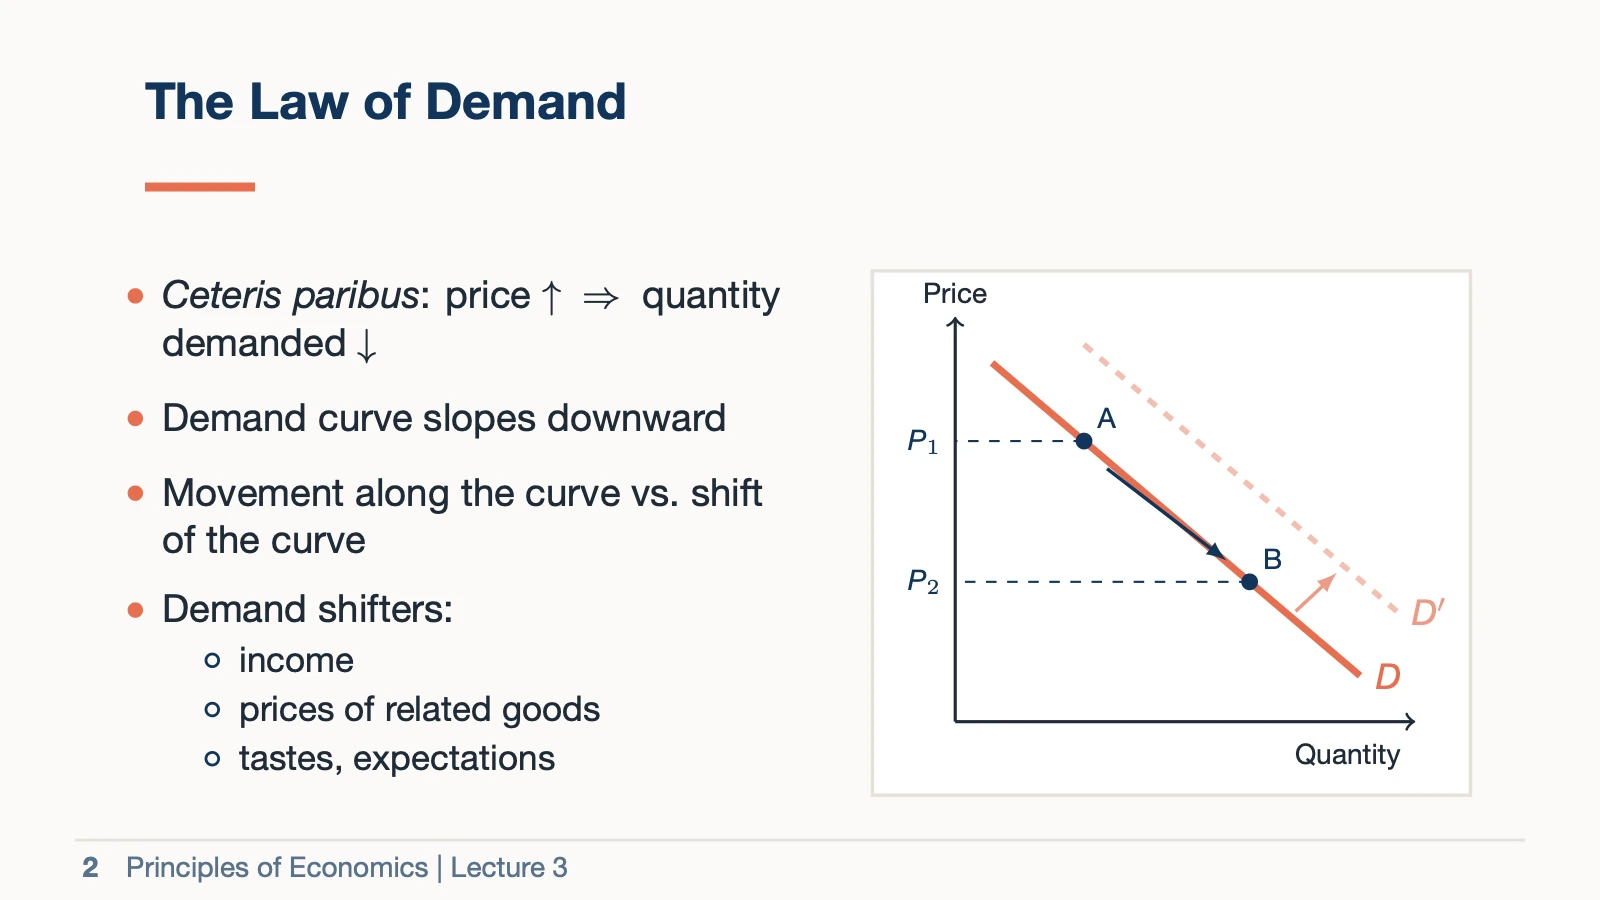
The Demand Curve: This relationship is visually represented by the demand curve (labeled on the graph), which slopes downward from left to right. The curve shows the quantity demanded at each possible price.
-
Two Types of Changes: It is crucial to distinguish between:
- A Movement Along the Demand Curve: This is caused only by a change in the good's own price. For example, on curve , a price drop from to causes a movement from point to point , resulting in a higher quantity demanded.
- A Shift of the Entire Demand Curve: This occurs when an external factor, other than the good's own price, changes. This changes the quantity demanded at every price level. The curve moves to a new position, such as from to .
-
Demand Shifters (Determinants of Demand): These are the "other things" that must be held constant for the law of demand to apply. When they change, the demand curve shifts. Major shifters include:
- Income: Changes in consumers' purchasing power.
- Prices of Related Goods: This includes substitutes (goods that can replace each other) and complements (goods used together).
- Tastes and Preferences: Changes in consumer desires or trends.
- Expectations: Beliefs about future prices or income.
The graph illustrates both concepts: the downward-sloping curve , a movement along it from to , and an outward shift to a new curve .